How to create a crisp topographic map in R
May 14, 2022 | Milos Popovic
From GoogleMaps to weather apps, our online world is replete with applications that use topographic data. Thanks to open data platforms such as Copernicus Land Monitoring Service, NASA Earthdata Search and USGS Earth Explorer we are able to access a vast amount of satellite imagery. With a bit of computer prowess, nearly everyone can do it.
But, have you ever wondered how to use these data and create a crisp topographic map in R?
In this tutorial, we will programmatically access satellite imagery from several APIs to create such a map of Italy. We will use a single interface to query the data without even downloading raster data to your local drive 😲.
Without any further delay let’s get straight to it, shall we?
Import libraries
We’ll load a few important libraries, including several well-known fellows such as tidyverse and sf for spatial analysis and data wrangling; giscoR for importing a country shapefile; terra will help us use the raster format; and marmap provides a pretty topographic color palette!
We also have a newcomer in our ranks, elevatr. This library allows us to access several web services in search of raster elevation data. These include the Amazon Web Services Terrian Tiles and the Open Topography global datasets API.
windowsFonts(georg = windowsFont('Georgia'))

# libraries we need
libs <- c("elevatr", "terra", "tidyverse",
	"sf", "giscoR", "marmap")

# install missing libraries
installed_libs <- libs %in% rownames(installed.packages())
if (any(installed_libs == F)) {
  install.packages(libs[!installed_libs])
}

# load libraries
invisible(lapply(libs, library, character.only = T))
Get the map of Italy
In this section, we download the shapefile of Italy that will be used to crop the elevation data. As usual, we will call giscoR to rescue. Note that I used a rather low resolution to speed up the computation. But if you are equiped with a strong machine (and patience) you could go for a higher resolution.
# 1. GET COUNTRY MAP
#---------

crsLONGLAT <- "+proj=longlat +datum=WGS84 +no_defs"

get_sf <- function(country_sf, country_transformed) {

	country_sf <- giscoR::gisco_get_countries(
    	year = "2016",
    	epsg = "4326",
    	resolution = "10",
    	country = "country")

	country_transformed <- st_transform(country_sf, crs = crsLONGLAT)

	return(country_transformed)
}

country_transformed <- get_sf()
Import elevation data
As mentioned above, we will use elevatr library to import elevation data. Under get_elev_raster we define several parameters.
First, locations is the type of the object that we will use to crop the global elevation data and this could be a data.frame, shapefile, or raster object. In our case, we will pass the shapefile of Italy. If you would like to capture the topography of the surrounding countries, then you should define a bounding box in the form of a data.frame.
In the second argument, z = 9 we set the ground resolution of any given pixel cell. We chose a bit lower zoom to limit the amount of resources used. But you can choose other values ranging from 1 (high-level detail) to 14 (low-level detail). We declare that the elevation data should be clipped by locations that we have previously defined.
# 2. GET ELEVATION DATA
#---------

get_elevation_data <- function(country_elevation, country_elevation_df) {

	country_elevation <- get_elev_raster(
		locations = country_transformed,
		z = 9,
		clip = "locations")

	country_elevation_df <- as.data.frame(country_elevation, xy = T) %>%
		na.omit()

	colnames(country_elevation_df)[3] <- "elevation"

	return(country_elevation_df)
}

country_elevation_df <- get_elevation_data()
This will return a RasterLayer object, which we will then transform into a data.frame and get rid of the missing values. The resulting data.frame will have three columns: x, y, and elevation value (we renamed this to “elevation” in the last line of the code).
head(country_elevation_df)

             x        y elevation
4711  12.13597 47.08060      2839
14873 12.13247 47.07943      2762
14874 12.13364 47.07943      2775
14875 12.13480 47.07943      2799
14876 12.13597 47.07943      2805
14877 12.13714 47.07943      2779
Map elevation data
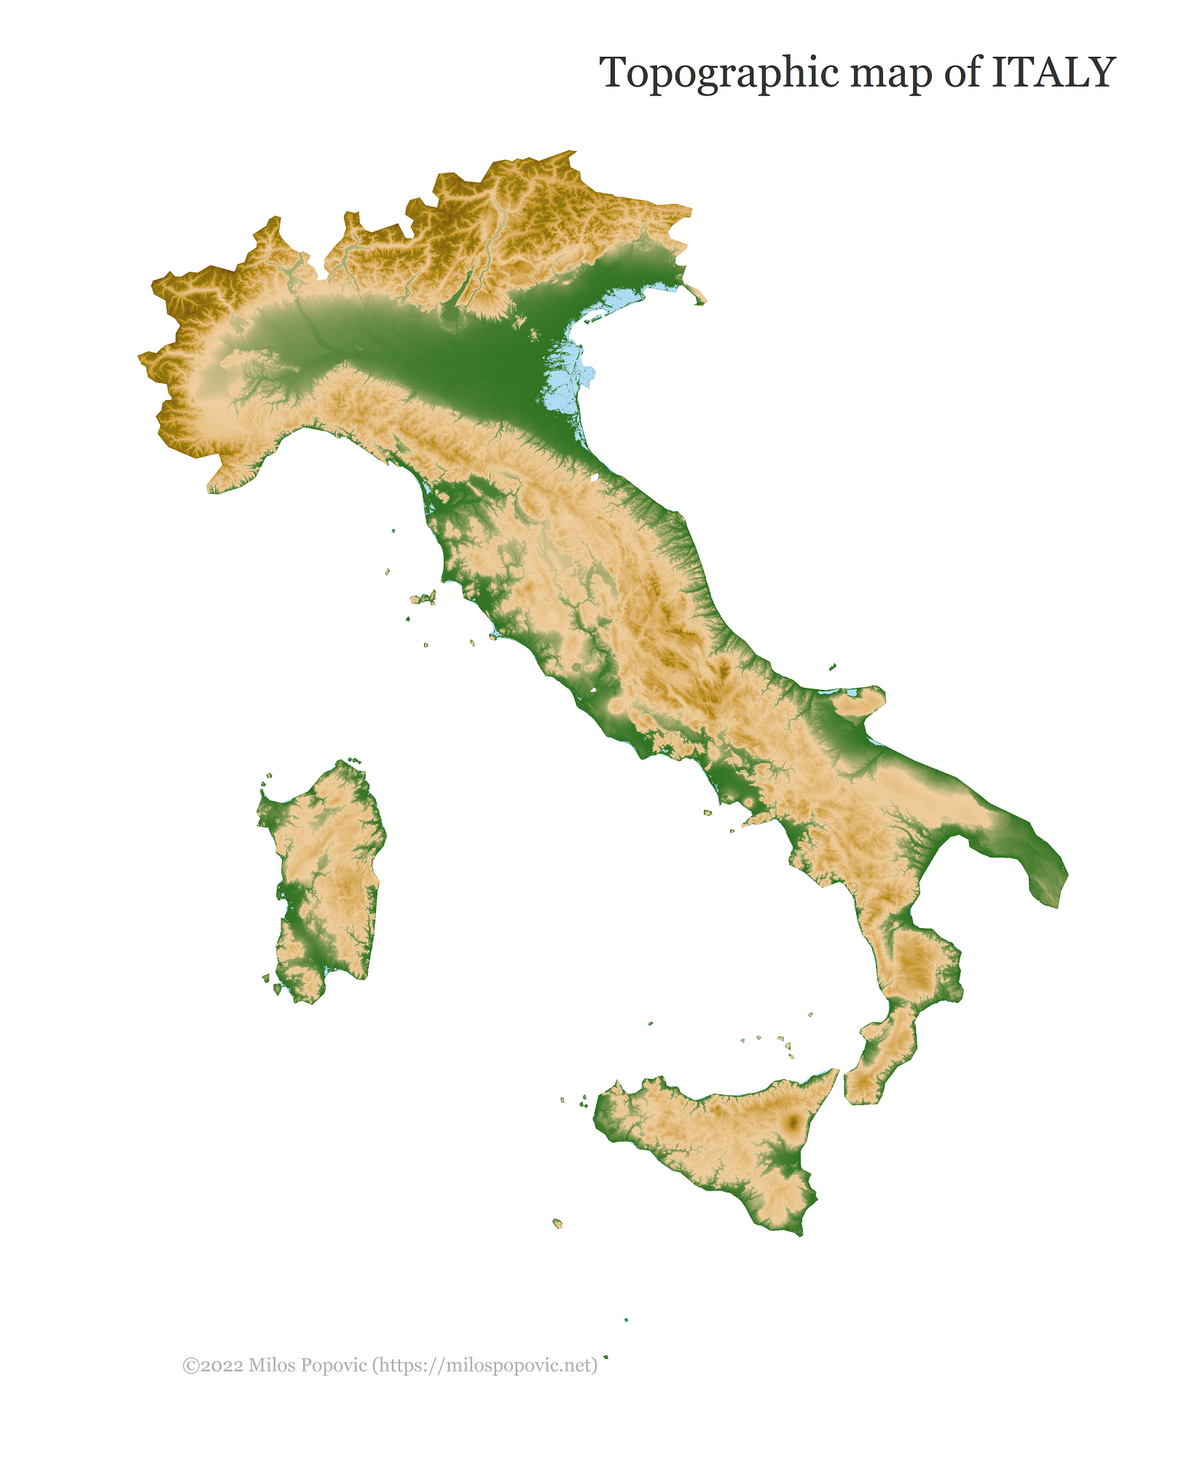
We’re all set to create our topographic map of Italy 🤩! Let’s pass our elevation data to geom_tile and define the coordinates as well as the fill value. Next, we call scale_fill_etopo() from marmap library for a pretty topography palette. Finally, we define the longlat coordinate reference system and set several usual plot parameters.
# 3. MAP
#---------

get_elevation_map <- function(country_map) {

	country_map <- ggplot() +
  		geom_tile(data = country_elevation_df,
  			aes(x = x, y = y, fill = elevation)) +
  		scale_fill_etopo() +
  		coord_sf(crs = crsLONGLAT)+
  		theme_minimal() +
  		theme(text = element_text(family = "georg", color = "#22211d"),
    		axis.line = element_blank(),
    		axis.text.x = element_blank(),
    		axis.text.y = element_blank(),
    		axis.ticks = element_blank(),
    		axis.title.x = element_blank(),
    		axis.title.y = element_blank(),
    		legend.position = "none",
   		  	panel.grid.major = element_line(color = "white", size = 0.2),
    		panel.grid.minor = element_blank(),
    		plot.title = element_text(size=18, color="grey20", hjust=1, vjust=-5),
    		plot.caption = element_text(size=8, color="grey70", hjust=.15, vjust=20),
    		plot.margin = unit(c(t=0, r=0, b=0, l=0),"lines"), #added these narrower margins to enlarge maps
    		plot.background = element_rect(fill = "white", color = NA),
    		panel.background = element_rect(fill = "white", color = NA),
    		panel.border = element_blank()) +
		labs(x = "",
    		y = NULL,
    		title = "Topographic map of ITALY",
    		subtitle = "",
    		caption = "©2022 Milos Popovic (https://milospopovic.net)")

	return(country_map)
}

country_map <- get_elevation_map()

ggsave(filename="italy_topo_map.png", width=7, height=8.5, dpi = 600, device='png', country_map)
Ladies and gents, here it is! 🥳
In this tutorial, you’ve learned how to easily load satellite data and make a cool elevation map of Italy. And all this programmatically in R! Feel free to check the full code here, clone the repo and reproduce, reuse and modify the code as you see fit.
Using this code you can create your own elevation map for any country in the world! You just need to change the name of the country in section 1 where we defined Italy and you’re good to go! Give it a try and let me know how it goes!
I’d be happy to hear your view on how this map could be improved or extended to other geographic realms. To do so, please follow me on Twitter, Instagram or Facebook! Also, feel free to support my work by buying me a coffee here!
